Span of Control Calculator
Enter the people and the managers to get the average span of control, or solve for managers and layers.
Recent
Your last 10 settings, saved only in this browser. Nothing is uploaded.
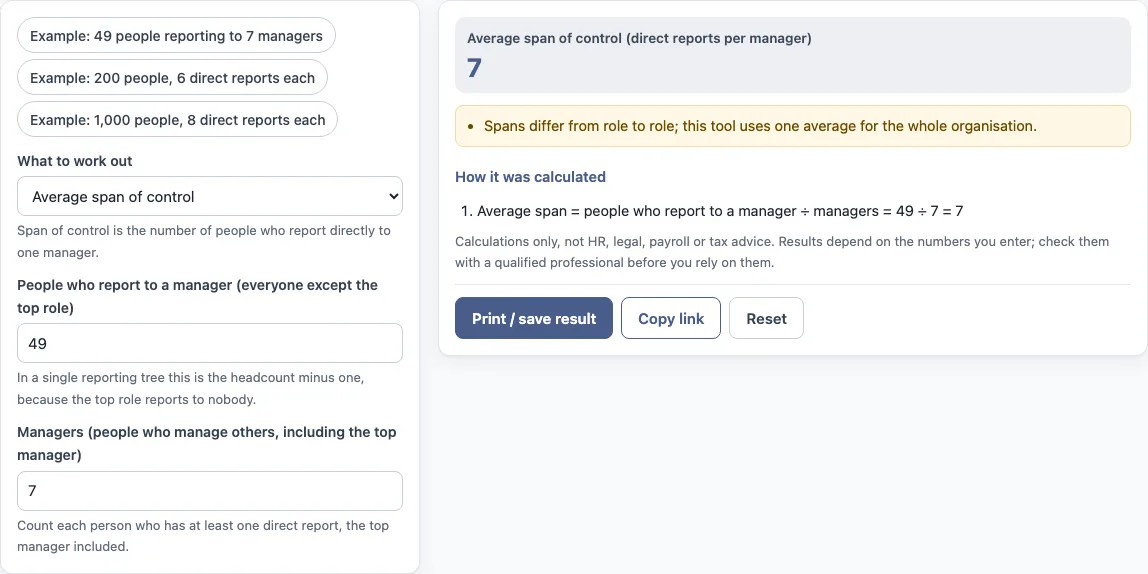
How to use the span of control calculator
- Under “What to work out”, choose “Average span of control” or “Managers and layers for a span”.
- In average mode, enter “People who report to a manager” (everyone except the top role) and “Managers (people who manage others, including the top manager)”.
- In layers mode, enter “Total headcount” (everyone, the top role included) and “Direct reports per manager”.
- Read the results: “Average span of control”, “Managers needed” and “Management layers needed (top role included)”.
- Check “How it was calculated” under the result to see each step with your numbers.
The three preset buttons fill the form with example values. “Reset” restores the default example. The values in the form are examples, not real company data, so replace every one with your own numbers. “Print / save result” creates a one-page sheet with your inputs, results, calculation steps and the date; you can save it as a PDF from the print dialog. “Copy link” copies a link that reopens the same inputs, and the page address keeps your inputs after any change.
The results update as you type. In layers mode the table shows how many people each additional layer can reach at your span, and the result lists the managers needed and the layers needed together.
What does span of control mean? Span of control meaning and span of control definition
Span of control is the number of people who report directly to one manager. The term describes how many direct reports each manager has within a reporting structure, which is the figure this tool calls the average span when it covers a whole organisation.
The tool uses one average span for the whole organisation. Spans can differ from role to role, so a single average does not describe every manager.
How do I calculate the managers needed for a span?
Start with the average span. Average span = people who report to a manager ÷ managers. In one reporting tree, everyone except the top role reports to someone, so the number of people reporting to a manager is the headcount minus one. For the default example, 49 people reporting to 7 managers gives 49 ÷ 7 = 7.
To work out managers needed from a headcount and a span, the tool uses managers needed = ceil((headcount − 1) ÷ span). “Ceil” means round up to the next whole number, because you cannot have a part of a manager.
Management layers needed is the smallest number of layers L where 1 + s + s² + … + s^(L−1) is at least the headcount, with s as the span. Each layer adds a further multiple of the span. The tool also shows a table of the headcount reachable with 1, 2, 3 and more layers at that span.
Organisations, policies and contracts can define these terms differently, so check your own definitions before using a result in a formal document.
Worked examples from the presets
The preset “Example: 200 people, 6 direct reports each” gives managers needed = ceil(199 ÷ 6) = 34. With a span of 6 the headcount reachable is 1 with one layer, 7 with two, 43 with three and 259 with four, so four layers are needed to reach 200 people. The preset “Example: 1,000 people, 8 direct reports each” needs ceil(999 ÷ 8) = 125 managers, and five layers, because four layers reach only 585 people at a span of 8. These are the tool’s own results for the example values.
Sources: Wikipedia: Span of control.
Frequently asked questions
What is a wide or narrow span of control?
A wide span means more direct reports per manager, and a narrow span means fewer. The tool does not say which is better, and spans differ by role and work.
Is there an ideal or optimal span of control?
The tool does not state an ideal, optimal or target span. It only calculates the numbers you enter.
Why does the average span use people who report to a manager instead of total headcount?
In one reporting tree, the top role reports to nobody, so it is left out of the count of people who report to a manager. Total headcount includes the top role and is used in layers mode instead.
Can I use the calculator for a single role, such as a CEO span of control?
The tool uses one average span for the whole organisation. It does not separate the span of one role, such as a CEO, from the rest of the organisation.
Can I use the results in HR reports or board packs?
Yes. Results may be used in commercial work such as HR reports, policies, board packs and client documents without attribution. The tool is arithmetic only and gives no HR, legal, payroll or tax advice, and it does not say what a result means for any person.
Does the tool save my data?
Everything runs in your browser, and nothing you type is uploaded.
Related tools
- FTE calculator: use it to convert working hours into full-time equivalent headcount.
- FTE hours calculator: use it to work out the hours behind a full-time equivalent figure.
- FTE salary calculator: use it to work out salary figures for a full-time equivalent role.
- Bradford factor calculator: use it to calculate a Bradford factor score from absence records.
- Absence rate calculator: use it to work out the rate of absence over a period.
- Turnover rate calculator: use it to work out how many leavers a period produced relative to headcount.
- Cost per hire calculator: use it to work out what a hire costs using your own figures.