Pay Band Calculator
Enter the number of bands, the first midpoint, the progression and the spread to build the bands.
Recent
Your last 10 settings, saved only in this browser. Nothing is uploaded.
This free pay band calculator builds a set of pay bands from the numbers you enter: how many bands, the midpoint of the first band, the midpoint progression between bands, and the range spread of each band. A pay band is the range of pay for a job grade, and the tool shows the minimum, midpoint and maximum of every band in a table.
The tool runs in your browser. It needs no account or sign-up, and nothing you type is uploaded. It applies arithmetic only. Pay bands are designed by each employer, so the figures it produces depend entirely on the values you enter.
How to use the pay band calculator
- Enter the “Number of bands”. You can choose from 2 to 20.
- Enter the “Midpoint of the first band ($)”, which is the middle of the first band.
- Enter the “Midpoint progression between bands (%)”, which is how much the midpoint rises from one band to the next.
- Enter the “Range spread of every band (%)”, which is how far each band’s maximum sits above its minimum, as a percentage of the minimum.
- Read the results: “Midpoint of the last band”, “Overall minimum (first band)” and “Overall maximum (last band)”. The full set of bands appears in the table “Pay bands”.
- Open “How it was calculated” under the result to see each formula step with your own numbers.
You can start from one of the three preset buttons, which fill the form with example values. “Reset” restores the example values. Replace every value with your own numbers before you use the result.
“Print / save result” prints a one-page sheet with your inputs, results, calculation steps and the date. To save it, choose PDF from the print dialog. “Copy link” copies a link that reopens the same inputs, and the page address keeps your inputs after any change.
Pay band meaning: salary band meaning and salary band definition
A pay band is the range of pay for a job grade. Each band has a minimum, a midpoint and a maximum. Pay bands, salary bands and compensation bands mean the same idea, so a salary band definition is the same as a pay band definition. Some organisations, policies or contracts define these terms differently, so check the source document that applies to you.
Each employer designs its own bands. This tool does not look up or compare any employer’s bands. It applies the formulas to the numbers you enter. For each band, the minimum is the midpoint divided by (1 + spread ÷ 200), and the maximum is the minimum multiplied by (1 + spread ÷ 100). Range spread is therefore (maximum − minimum) ÷ minimum.
What is the midpoint progression?
The midpoint progression is the percentage by which the midpoint rises from one band to the next. The tool calculates the midpoint of band k as the first midpoint × (1 + progression %)^(k − 1).
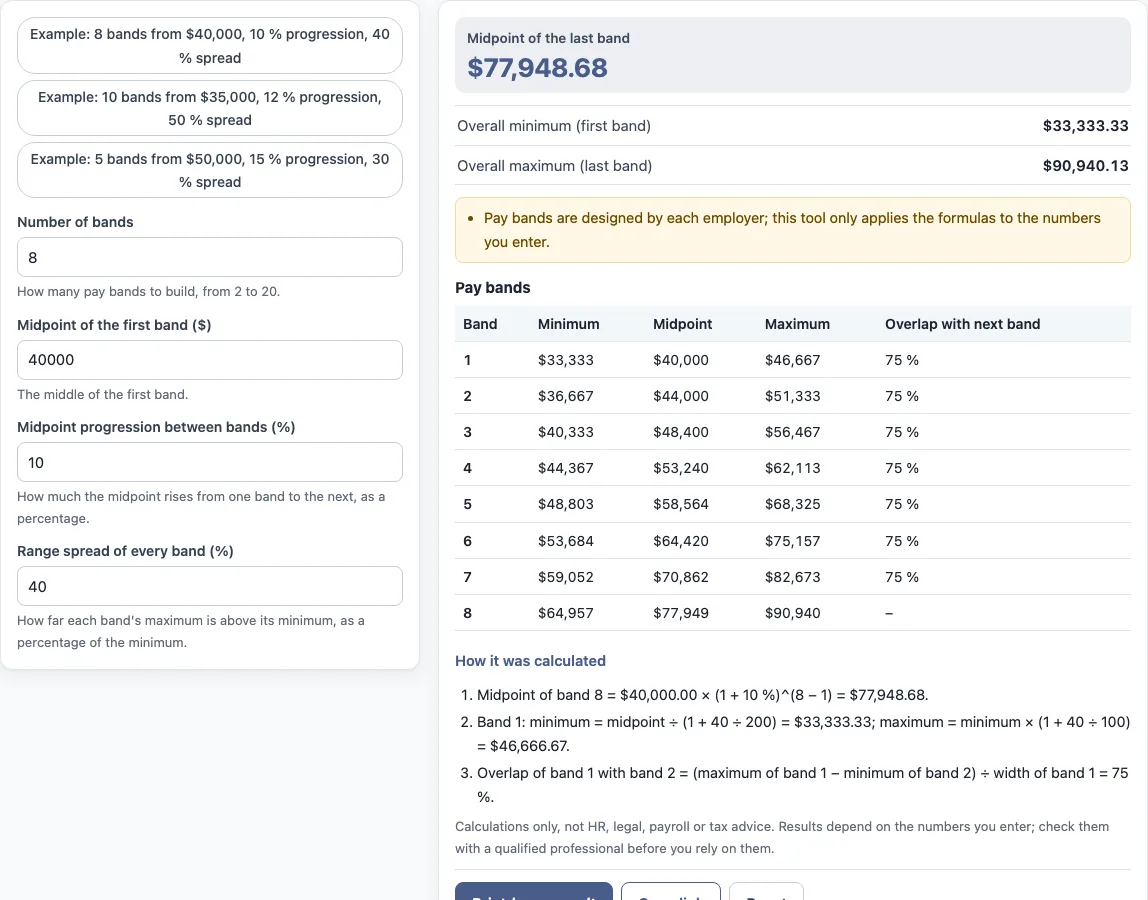
For example, with a first midpoint of $40,000.00, a 10 % progression and eight bands, the tool gives a midpoint of $77,948.68 for band 8. For band 1, with a 40 % spread, the minimum is $33,333.33 and the maximum is $46,666.67.
What is the range spread?
Range spread is how much wider the band is than its minimum: (maximum − minimum) ÷ minimum. In this tool the same spread is applied to every band, and the minimum of each band is found from its midpoint, so the midpoint stays exactly halfway between the minimum and the maximum. With a 40 % spread, a band with a midpoint of $40,000 runs from $33,333.33 to $46,666.67.
What is the overlap between pay bands?
Overlap is the part of one band that is also inside the next band. The tool works it out as (maximum of this band − minimum of the next band) ÷ (maximum − minimum of this band) × 100, and shows 0 when the bands do not overlap. A higher progression moves each midpoint further from the last, so overlap falls; a wider spread makes each band longer, so overlap grows. The last band has no next band, so the table shows a dash for it. The table lists the minimum, midpoint, maximum and overlap for every band so you can read the structure at a glance.
What do the overall minimum and maximum show?
“Overall minimum” is the minimum of the first band and “Overall maximum” is the maximum of the last band. Together with the midpoint of the last band they describe the full width of the structure you built.
Sources: Wikipedia: Pay grade.
Frequently asked questions
What is the overlap between pay bands?
The overlap between a band and the next band is (maximum of this band − minimum of the next band) ÷ (maximum − minimum of this band) × 100. The tool shows this value in the table, and it shows 0 when two bands do not overlap. With the default values, the overlap of band 1 with band 2 is 75 %.
Do salary bands and compensation bands mean the same thing?
Yes. In this tool, pay bands, salary bands and compensation bands all refer to the same idea: the range of pay for a job grade, with a minimum, midpoint and maximum.
Does the tool look up pay bands or market pay data?
No. Pay bands are an employer’s design, and the tool does not look up any employer’s or government’s pay bands. It also does not use market or salary survey data, inflation figures or pay scales.
Are the values in the form real company data?
No. The values already in the form are examples. Replace every one with your own numbers before you use the result.
Can I use the results in HR reports or policies?
Yes. Results may be used in commercial work, such as HR reports, policies, board packs and client documents, without attribution. The tool is arithmetic only and gives no HR, legal, payroll or tax advice, and it does not say what a result means for any person.
Does the tool calculate tax or take-home pay?
No. The tool does not calculate tax, take-home pay, sick pay or any legal entitlement. It shows only the band minimums, midpoints and maximums that follow from the formulas.
Related tools
- Compa ratio calculator: use it to compare a pay figure with the midpoint of a band.
- Salary range calculator: use it to work out the minimum and maximum of a single salary range.
- Salary range penetration calculator: use it to see where a pay figure sits within a salary range.
- Pay scale calculator: use it to lay out a pay scale of steps.
- Merit increase calculator: use it to work out a merit increase as a percentage.
- Pay raise calculator: use it to work out the size of a pay rise.
- Salary growth calculator: use it to see how a salary changes over several years at a set rate.